Linear Equations and Slope
Objectives
When you complete this lesson, you will be able to:
- Use the term “slope” to describe lines and rates of change.
- Find the slope of lines on graphs.
- Find the slope of a line when given two of its points.
- Define the slope of horizontal and vertical lines.
Prior Knowledge
Before beginning this lesson you should be able to:
- Graph ordered pairs.
- Identify ordered pairs from a graph.
LESSON SUMMARY
In this lesson, we learned about the slope of a line. The slope of a line describes the rate at which the value of y changes for a given change in the value of x. To find slope from a graph of a line, we can look at two points on the line and then find the ratio that measures the vertical
change between the two points divided by the horizontal change between those points.
\(\frac{Vertical\;Change}{Horizontal\;Change}\)
We count along grid lines from one point to the other. Counting up or to the right is written as positive change. Counting down or to the left is written as negative change.
In the graph below, the vertical change is 3. The horizontal change is 4. The slope is \(\frac34\).

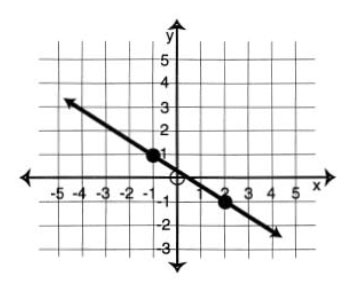
In the graph below, the vertical change is -2. The horizontal change is 3. The slope is \(-\frac23\). We could also have worked in the other direction. In that case, the vertical change is 2 and the horizontal change is -3. The slope is still \(-\frac23\).
We can also find the slope of a line with two ordered pairs. We use the following formula to find the change in they-coordinates divided by the change in the x-coordinates. The numerator of the formula is read “y-sub-two minus y-sub-one.” The denominator is read “x-sub-two minus x-sub-one.”
\(m\;=\;\frac{y_2-y_1}{x_2-x_1}\)
In the formula, “m” stands for slope. The two ordered pairs are ( x
1, y
1 ) and ( x
2, y
2 ) . It’s not important which pair is labeled sub-one or sub-two. But it is important to substitute the coordinates into the formula in a consistent order.
For example, if two points on a line are (3, -2) and (4, -4), the slope of the line is:
\(m\;=\;\frac{y_2-y_2}{x_2-x_1}=\frac{-4-\left(-2\right)}{4-3}=\frac{-2}1=-2\)
Slopes can be positive or negative. Lines that have the same slope are parallel. Their graphs will never intersect.
Horizontal and vertical lines are special cases. Horizontal lines have a slope of 0 and vertical lines have no slope at all.
We can use slope to relate the units in a problem. For example, if an equation is about the number of miles traveled in a certain number of hours, the slope of the line will tell us the speed in miles per hour. The y-axis is labeled miles and the x-axis is labeled hours.
In addition to finding slope from a graph or from ordered pairs, we can also find slope from the equation. We just find two ordered pairs that satisfy the equation, then use the ordered pairs in the slope formula.
For example, in the equation 3
x +
y =12 , two ordered pairs are (1, 9) and (2, 6). We use the ordered pairs in the slope formula like this:
\(m\;=\;\frac{y_2-y_2}{x_2-x_1}=\frac{6-9}{2-1}=\frac{-3}1=-3\)
Examples
These examples can help you master the new ideas in this lesson.
1. From the graph below, give the slope of Line 1 and Line 2.
 Solutions:
On Line 1, look at the points (1, 2) and (4, 4). To get from (1, 2) to (4, 4) count up 2, then to the right 3. The slope is \(\frac23\).
On Line 2, look at the points (1, 2) and (4, 1). To get from (1, 2) to (4, 1) count down 1, then right 3. The slope is \(-\frac13\).
2. Give the slope of the line that contains each pair of points.
a) (5, 7) and (12, 18)
b) (-3, -8) and (-2, -12)
c) (2.6, -4.5) and (1.8, -2.1)
d) (3, -2) and (2, -2)
e) (-1, 1 2) and (-1, -2)
Solutions:
In each case, substitute the coordinates into the slope-intercept formula, then simplify and reduce.
a) \(m=\frac{y_2-y_2}{x_2-x_1}=\frac{18-7}{12-5}=\frac{11}7\)
b) \(m=\frac{y_2-y_2}{x_2-x_1}=\frac{-12-\left(-8\right)}{-2-\left(-3\right)}=\frac41=4\)
c) \(m=\frac{y_2-y_2}{x_2-x_1}=\frac{-2.1-\left(-4.5\right)}{1.8-2.6}=\frac{2.4}{-0.8}=-3\)
d) These two lines have the same y-coordinates. Without using the formula, you can observe this is a horizontal line. The slope of all horizontal lines is 0.
e) The two lines have the same x-coordinates. Without even using the formula, you can observe that this is a vertical line. Vertical lines do not have any slope at all.
3. Answer the following questions.
a) A graph shows the income from selling strawberries. The x-axis is labeled pints of strawberries and the y-axis is labeled dollars. What does the slope of the graph tell you?
b) The slope of a line on a graph tells you the cost per foot of fencing. How should the axes of the graph be labeled?
Solutions:
a)The slope of the graph will be the change in dollars divided by the change in pints of strawberries. That’s the same as the cost per pint of strawberries.
b)The slope of a line tells the change in y over the change in x. Thus y must be in dollars and x must be feet of fencing.
Practice Problems
These problems will give you more experience with the material in this lesson.
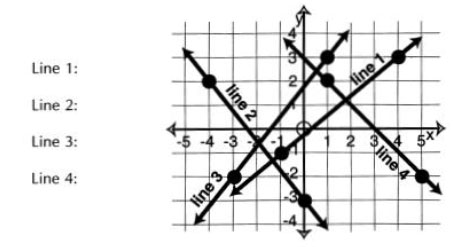
1. Give the slope of each line on the graph below.
2. Find the slope of the lines that contain the following pairs of points.
a) (27, 86) and (17, 42)
b) (2.1, 4.8) and (-2.5, 2.5)
c) (3, 6) and (-2, 6)
d) (-2, -11) and (1, -8)
e) (4, -3) and (-2, 5)
f) (2/3, 6) and (2/3, -4)
g) (-5, -11) and (-12, 4)
h) (7.35, 16.23) and (7.17, 4.17)
3. Answer the following questions:
a) A graph shows the conversion between pints and gallons. The x-axis shows the gallons and the y-axis shows the pints. What does the slope of the graph show?
b) A graph shows the balance owed on a loan. The x-axis is labeled months and the y-axis is labeled dollars remaining. What does the slope of the graph show?
c) The slope of a line shows how quickly in feet per second a balloon is rising into the air. How would the axes be labeled?
d) The slope of a graph shows how fast the deficit is growing in millions of dollars per year. How would the axes be labeled?
Answers to Practice Problems
1.
Line 1: \(\frac45\)
Line 2: \(-\frac54\)
Line 3: \(\frac54\)
Line 4: -1
2.
a) \(\frac{22}5\)
b) \(\frac12\)
c) 0
d) 1
e) \(-\frac43\)
f) no slope (or undefined)
g) \(\frac{15}{-7}\)
h) 67
3.
a) pints per gallon
b) monthly loan payment
c) x-axis: seconds y-axis: feet
d) x-axis: years y-axis: millions of dollars

